Report · Oct 2026
Hospital Bad Debt Statistics: 2026 Report
Published
When a patient doesn't pay a deductible, a copay or a bill for care they had no insurance for, the hospital often never collects it. Each year hospitals write off billions of dollars of these unpaid balances, an amount known as bad debt. Small rural hospitals and government hospitals carry far more of it relative to their budgets, so we looked at how much hospitals lose and where.
Our analysts studied the Medicare cost reports of 4,373 US hospitals for FY2024, with FY2023 for comparison. We measured how much hospitals write off and how that differs by hospital type, ownership and state. Hospitals reported $54.30 billion of bad debt in FY2024, up 7.5% from $50.51 billion. At cost, bad debt was $12.31 billion, or 0.88% of total operating expenses.
In the following sections, we give the national totals alongside charity care, then break bad debt down by hospital type, ownership and state.
National Hospital Bad Debt Statistics, FY2023 and FY2024
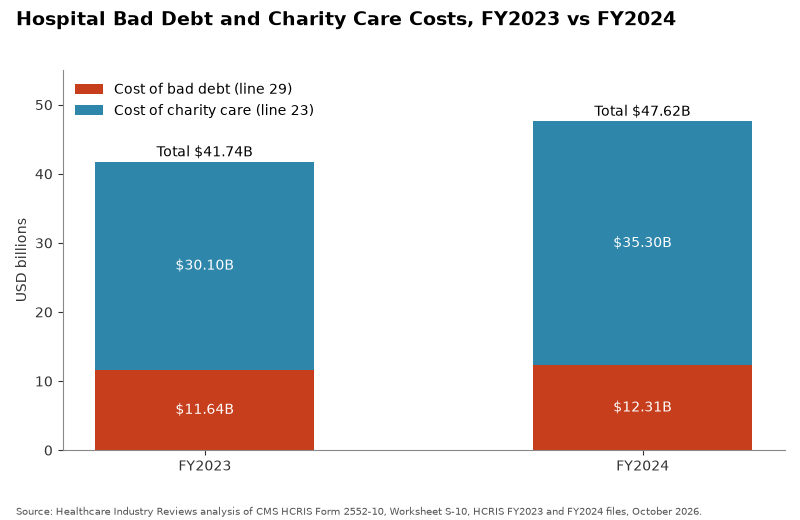
Bad debt is money hospitals never collect from patients, and the national totals show how large that loss is and how it compares with the free care hospitals give through charity programs.
| Measure | FY2023 | FY2024 | Change |
|---|---|---|---|
| Hospitals reporting S-10 | 4,403 | 4,373 | -0.7% |
| Bad debt, line 26 | $50.51B | $54.30B | +7.5% |
| Medicare allowable bad debt, line 27.01 | $2.56B | $2.44B | -4.7% |
| Medicare reimbursable bad debt, line 27 | $1.67B | $1.59B | -4.7% |
| Non-Medicare bad debt, line 28 | $47.95B | $51.85B | +8.1% |
| Cost of non-Medicare and non-reimbursable Medicare bad debt, line 29 | $11.64B | $12.31B | +5.8% |
| Cost of charity care, line 23 | $30.10B | $35.30B | +17.3% |
| Cost of uncompensated care, line 30 | $41.74B | $47.62B | +14.1% |
| Bad debt cost as % of total operating expenses | 0.90% | 0.88% | -0.02 points |
| Median hospital bad debt cost as % of operating expenses | 1.06% | 1.08% | +0.02 points |
| Bad debt share of uncompensated care cost | 27.9% | 25.9% | -2.03 points |
| Median hospital bad debt, line 26 | $4.4M | $4.9M | +10.2% |
- Hospitals reported $54.30 billion of bad debt on S-10 line 26 in FY2024, up 7.5% from $50.51 billion. At cost, bad debt was $12.31 billion, or 0.88% of total operating expenses.
- The median hospital's bad debt cost was 1.08% of its operating expenses, and half of hospitals fell between 0.56% and 2.07%.
- Bad debt was 25.9% of the $47.62 billion cost of uncompensated care in FY2024. Charity care cost rose 17.3%, faster than bad debt cost at 5.8%.
- Medicare reimbursable bad debt was 65.0% of Medicare allowable bad debt in FY2024.
- The 10% of hospitals with the most bad debt accounted for 50.9% of the national line 26 total.
- For hospitals, unpaid patient bills are a growing cost, though a small share of total spending. Bad debt rose 7.5% to $54.30 billion in FY2024, or 0.88% of operating expenses at cost. If patient balances keep rising, bad debt is likely to keep growing faster than hospital budgets.
Hospital Bad Debt by Hospital Type
Splitting the figures by hospital type shows whether small rural hospitals carry more unpaid patient bills, relative to their budgets, than larger general hospitals.
Short-term acute care hospitals hold 0001 to 0879 in the last four digits of their CMS Certification Number, and critical access hospitals hold 1300 to 1399. Children's, psychiatric, long-term care and rehabilitation hospitals that file S-10 are grouped as other hospital types.
| Hospital Type | Hospitals | Bad Debt (Line 26) | Cost of Bad Debt (Line 29) | Bad Debt Cost % of Operating Expenses | Median Hospital % | Bad Debt Share of Uncompensated Care Cost |
|---|---|---|---|---|---|---|
| Short-term acute care | 3,007 | $51.22B | $11.00B | 0.82% | 0.85% | 24.3% |
| Critical access | 1,339 | $2.86B | $1.25B | 2.20% | 1.92% | 57.0% |
| Other hospital types | 27 | $214.0M | $60.6M | 1.27% | 1.00% | 30.9% |
| Hospital Type | Hospitals | Bad Debt (Line 26) | Cost of Bad Debt (Line 29) | Bad Debt Cost % of Operating Expenses | Median Hospital % | Bad Debt Share of Uncompensated Care Cost |
|---|---|---|---|---|---|---|
| Short-term acute care | 3,047 | $47.83B | $10.45B | 0.84% | 0.84% | 26.4% |
| Critical access | 1,337 | $2.52B | $1.14B | 2.17% | 1.87% | 58.1% |
| Other hospital types | 19 | $157.4M | $45.4M | 1.18% | 0.95% | 32.4% |
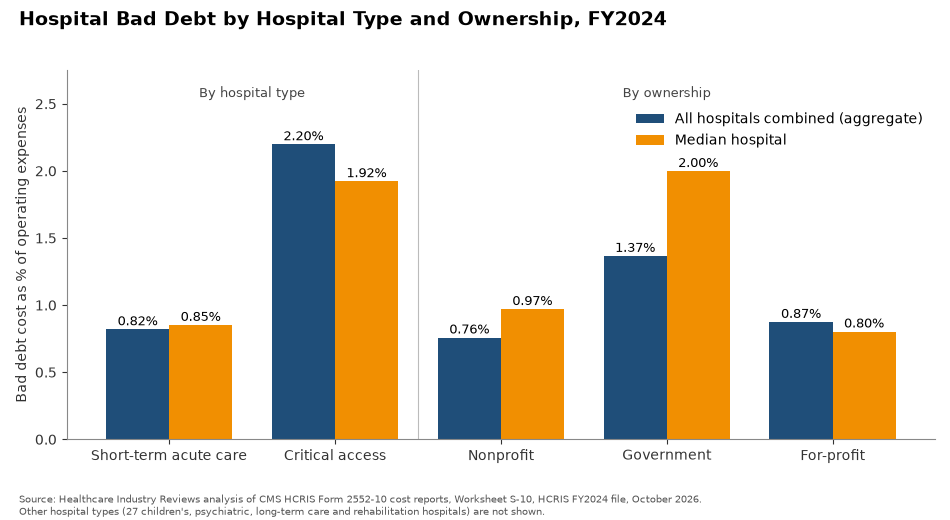
- Critical access hospitals' bad debt cost was 2.20% of operating expenses in FY2024, against 0.82% at short-term acute care hospitals.
- Bad debt made up 57.0% of uncompensated care cost at critical access hospitals and 24.3% at short-term acute care hospitals. Charity care made up the rest.
- Short-term acute care hospitals reported 94.3% of national line 26 bad debt, $51.22 billion.
- Rural critical access hospitals carry the heaviest bad debt burden. Their bad debt cost was 2.20% of operating expenses, against 0.82% at acute care hospitals, and it rose 12.7% among hospitals reporting both years. These small hospitals are likely to feel the most strain if the trend continues.
Hospital Bad Debt by Ownership
Comparing nonprofit, for-profit and government hospitals shows which kind of owner absorbs the most unpaid patient bills relative to its spending.
Ownership groups follow the HCRIS type-of-control codes: voluntary nonprofit (codes 1 and 2), proprietary (3 to 6) and government (7 to 13).
| Ownership | Hospitals | Bad Debt (Line 26) | Cost of Bad Debt (Line 29) | Bad Debt Cost % of Operating Expenses | Median Hospital % | Bad Debt Share of Uncompensated Care Cost |
|---|---|---|---|---|---|---|
| Nonprofit | 2,729 | $33.59B | $7.84B | 0.76% | 0.97% | 27.2% |
| Government | 933 | $11.88B | $3.44B | 1.37% | 2.00% | 26.8% |
| For-profit | 711 | $8.83B | $1.03B | 0.87% | 0.80% | 17.2% |
| Ownership | Hospitals | Bad Debt (Line 26) | Cost of Bad Debt (Line 29) | Bad Debt Cost % of Operating Expenses | Median Hospital % | Bad Debt Share of Uncompensated Care Cost |
|---|---|---|---|---|---|---|
| Nonprofit | 2,716 | $30.52B | $7.26B | 0.76% | 0.94% | 29.7% |
| Government | 936 | $11.03B | $3.27B | 1.41% | 2.00% | 27.3% |
| For-profit | 751 | $8.96B | $1.11B | 0.95% | 0.83% | 21.0% |
- The median government hospital's bad debt cost was 2.00% of operating expenses in both years. The median was 0.97% at nonprofit hospitals and 0.80% at for-profit hospitals in FY2024.
- For-profit hospitals reported $8.83 billion of line 26 bad debt and $1.03 billion at cost. Bad debt was 17.2% of their uncompensated care cost, the lowest share of the three groups.
- Government hospitals absorb the most bad debt relative to their size. Their median was 2.00% of operating expenses, against 0.80% at for-profit hospitals, where bad debt cost fell 4.0%. Public hospitals are likely to keep carrying a growing share of unpaid care.
Hospital Bad Debt Statistics by State
We totaled the figures for every state, so readers can see how hospitals where they live compare with the rest of the country.
The state table covers the 50 states and the District of Columbia. Puerto Rico, Guam and the US Virgin Islands are included in the national totals but not shown here.
| State | Hospitals | Bad Debt (Line 26) | Cost of Bad Debt (Line 29) | Bad Debt Cost % of Operating Expenses | Median Hospital % | Bad Debt Share of Uncompensated Care Cost |
|---|---|---|---|---|---|---|
| Mississippi | 89 | $1.17B | $248.4M | 2.46% | 2.64% | 43.9% |
| Alaska | 15 | $131.3M | $63.7M | 2.42% | 1.16% | 56.2% |
| Wyoming | 27 | $122.7M | $54.7M | 2.40% | 2.80% | 63.4% |
| Alabama | 84 | $1.35B | $278.0M | 1.74% | 2.46% | 39.3% |
| Georgia | 127 | $3.39B | $669.8M | 1.66% | 2.06% | 22.7% |
| South Carolina | 54 | $1.55B | $299.4M | 1.56% | 2.16% | 31.2% |
| Texas | 354 | $7.95B | $1.42B | 1.51% | 1.76% | 15.7% |
| Nevada | 33 | $1.00B | $123.7M | 1.47% | 1.61% | 30.5% |
| Maine | 33 | $291.1M | $108.7M | 1.29% | 1.43% | 61.3% |
| Arkansas | 75 | $511.2M | $123.1M | 1.26% | 1.49% | 34.4% |
| Oklahoma | 106 | $847.6M | $183.7M | 1.18% | 1.93% | 32.2% |
| North Carolina | 99 | $2.39B | $528.3M | 1.17% | 1.91% | 32.9% |
| Maryland | 30 | $256.3M | $175.4M | 1.13% | 1.24% | 41.2% |
| Missouri | 99 | $1.33B | $323.3M | 1.10% | 1.76% | 33.0% |
| Idaho | 42 | $274.6M | $93.0M | 1.09% | 1.88% | 44.0% |
| Florida | 178 | $5.10B | $827.4M | 1.07% | 0.88% | 18.4% |
| Kansas | 126 | $548.5M | $143.9M | 1.04% | 1.96% | 34.0% |
| Louisiana | 104 | $800.8M | $201.5M | 1.03% | 1.13% | 34.4% |
| Utah | 46 | $432.0M | $113.6M | 1.01% | 1.57% | 28.0% |
| Delaware | 6 | $160.8M | $49.1M | 1.00% | 1.08% | 43.0% |
| Nebraska | 87 | $279.3M | $93.9M | 0.95% | 1.27% | 36.3% |
| West Virginia | 46 | $368.1M | $103.1M | 0.93% | 1.16% | 58.2% |
| New Mexico | 35 | $263.2M | $74.4M | 0.93% | 1.12% | 32.9% |
| Iowa | 112 | $410.6M | $136.2M | 0.92% | 1.24% | 47.1% |
| North Dakota | 42 | $143.6M | $54.4M | 0.92% | 1.56% | 45.9% |
| Montana | 51 | $120.4M | $56.9M | 0.92% | 1.44% | 37.3% |
| South Dakota | 55 | $210.8M | $59.1M | 0.90% | 1.02% | 49.3% |
| New Hampshire | 26 | $235.5M | $68.3M | 0.88% | 1.14% | 35.1% |
| Virginia | 78 | $1.08B | $251.9M | 0.87% | 0.91% | 26.9% |
| Indiana | 116 | $1.28B | $287.0M | 0.87% | 1.04% | 35.5% |
| Kentucky | 89 | $880.2M | $197.1M | 0.87% | 1.19% | 42.6% |
| Illinois | 169 | $1.70B | $446.8M | 0.84% | 1.06% | 28.0% |
| New Jersey | 61 | $1.64B | $295.9M | 0.83% | 0.72% | 20.0% |
| Ohio | 148 | $2.04B | $454.7M | 0.81% | 1.21% | 32.0% |
| Rhode Island | 10 | $138.2M | $38.7M | 0.79% | 0.76% | 43.7% |
| Michigan | 126 | $1.30B | $347.8M | 0.78% | 0.99% | 41.7% |
| Tennessee | 93 | $1.15B | $220.6M | 0.77% | 1.27% | 19.0% |
| Vermont | 14 | $83.6M | $31.6M | 0.75% | 1.31% | 52.8% |
| Arizona | 67 | $1.02B | $180.8M | 0.75% | 0.78% | 26.0% |
| District of Columbia | 6 | $148.0M | $35.6M | 0.74% | 0.59% | 39.8% |
| Connecticut | 26 | $444.1M | $113.0M | 0.65% | 0.67% | 36.4% |
| Wisconsin | 122 | $703.8M | $188.6M | 0.64% | 0.89% | 37.0% |
| Colorado | 83 | $655.4M | $135.5M | 0.62% | 0.68% | 17.7% |
| New York | 150 | $1.60B | $711.3M | 0.61% | 0.58% | 21.4% |
| Massachusetts | 59 | $689.7M | $234.0M | 0.60% | 0.83% | 36.0% |
| Washington | 84 | $605.0M | $173.9M | 0.54% | 0.81% | 22.9% |
| Hawaii | 19 | $83.6M | $25.9M | 0.52% | 0.49% | 47.3% |
| Pennsylvania | 145 | $1.63B | $316.3M | 0.50% | 0.66% | 30.8% |
| Minnesota | 120 | $346.3M | $121.4M | 0.47% | 0.83% | 26.0% |
| California | 307 | $3.15B | $713.1M | 0.42% | 0.43% | 24.9% |
| Oregon | 56 | $157.8M | $54.2M | 0.28% | 0.31% | 10.8% |
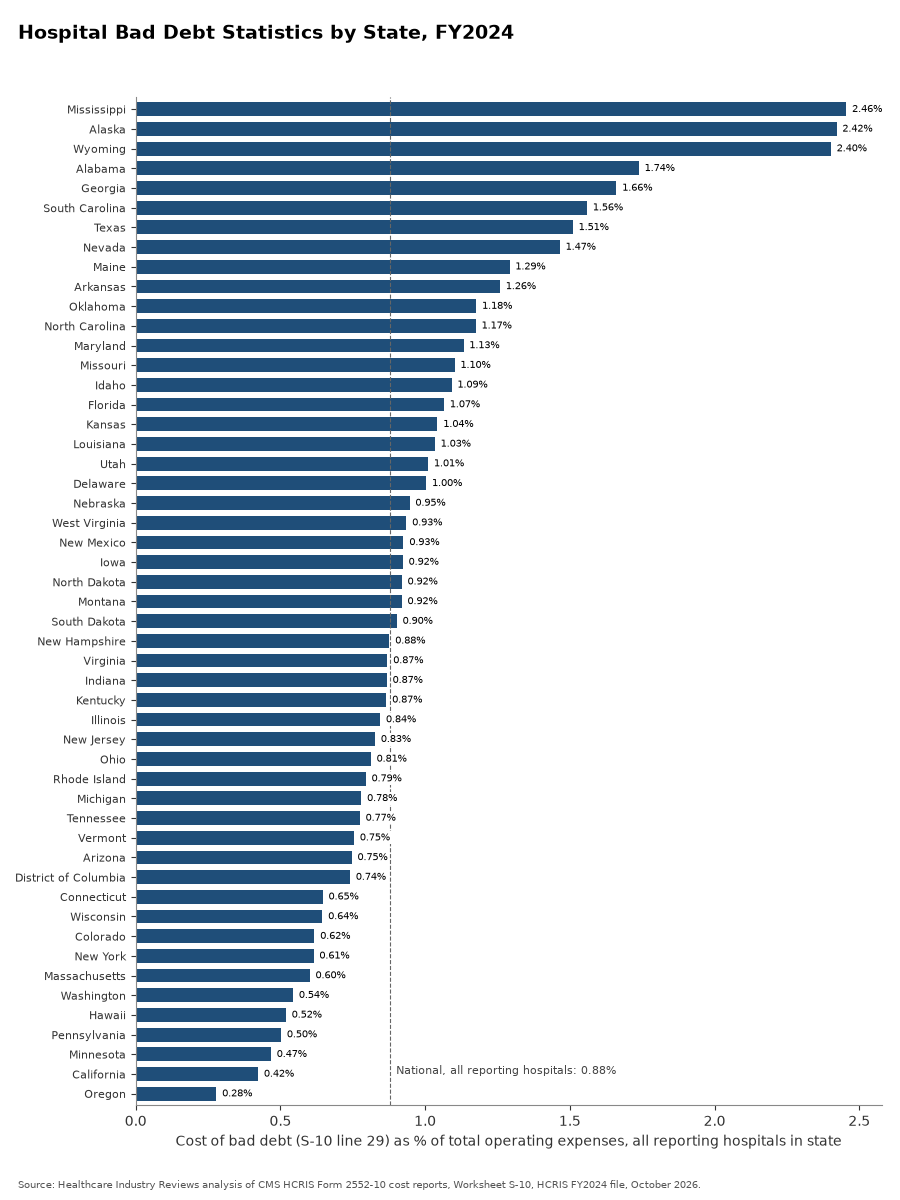
- Mississippi had the highest bad debt cost share, 2.46% of operating expenses, followed by Alaska at 2.42% and Wyoming at 2.40%.
- Oregon had the lowest, 0.28%, and California was second lowest at 0.42%.
- Texas hospitals reported the most bad debt, $7.95 billion on line 26 and $1.42 billion at cost. Bad debt was 15.7% of Texas hospitals' uncompensated care cost.
- Where a hospital operates shapes how much bad debt it carries. Mississippi, Alaska and Wyoming topped 2.40% of operating expenses, against 0.28% in Oregon and a 0.92% state median. Hospitals in high-burden states are likely to face the most pressure on margins.
- North Carolina's share fell from 1.53% in FY2023 to 1.17% in FY2024, the largest drop of any state.
What Hospital Bad Debt Trends Mean for 2027 and Beyond
Hospital bad debt is the cost of bills patients could not pay, and it keeps growing. A small number of hospitals carry most of it, especially rural and public hospitals that serve many uninsured patients. In those hospitals, unpaid bills can decide whether a service stays open.
Insurance coverage will largely decide where this goes. If more patients end up uninsured or underinsured, bad debt will rise faster and the hospitals under strain today will be hit hardest. Charity care programs that catch patients before a bill goes unpaid could ease some of that pressure.
So if you get a hospital bill you cannot pay, ask about the hospital's financial assistance program before it goes to collections.
Data Collection and Methodology
Cost reports are filed by thousands of hospitals on a fixed federal form, and a few features of that form shape how these numbers should be read.
The figures come from the Medicare cost reports that US hospitals file with the Centers for Medicare & Medicaid Services (CMS), as published in the CMS Healthcare Cost Report Information System (HCRIS) files for Form CMS-2552-10 as of October 8, 2026, using the latest report for each hospital. The HCRIS FY2024 file covers cost reporting periods that began between October 1, 2023, and September 30, 2024, and 4,373 hospitals in it reported bad debt on Worksheet S-10. The HCRIS FY2023 file, with 4,403 reporting hospitals, is the comparison year. The FY2025 file is still filling in as hospitals submit, so it is not used.
Line definitions follow the current Form 2552-10 instructions in Chapter 40 of the Provider Reimbursement Manual, Part 2 (Rev. 25). S-10 line 26 is the bad debt a hospital wrote off during the year, net of recoveries, on balances owed by patients. For periods beginning on or after October 1, 2022, it also includes implicit price concessions under accounting standards Topic 606. It excludes physician and professional services. Line 26 is in charges. Line 29 converts it to cost: non-Medicare bad debt (line 28) times the hospital's cost-to-charge ratio, plus the part of Medicare allowable bad debt that Medicare does not reimburse (line 27.01 minus line 27).
The main measure is the cost of bad debt (line 29) divided by total operating expenses (Worksheet G-3, line 4). It is shown two ways: all hospitals in a group added together, and the median hospital. Hospital type comes from the last four digits of the CMS Certification Number, and ownership from the type-of-control code in the HCRIS report file. National totals include 44 hospitals in Puerto Rico, Guam and the US Virgin Islands.
About 65% of the FY2024 reports used here have "as submitted" status, so figures can change after audit. Line 26 counts write-offs during the year regardless of when the care was given, so it does not match the care delivered in the year. The cost-to-charge ratio in line 29 is the hospital's overall ratio, so the cost figure is an estimate. Implicit price concessions entered line 26 for periods beginning on or after October 1, 2022, which means some FY2023 and FY2024 amounts may not be comparable with earlier years.
The number of reporting hospitals changes from year to year. Maryland went from 13 reporting hospitals in FY2023 to 30 in FY2024, so its year-over-year change reflects coverage. Puerto Rico, Guam and the US Virgin Islands are left out of the state table. Guam's single hospital reported bad debt cost equal to 17.39% of operating expenses. Hospitals that do not file S-10 or report no line 26 value are not counted.
Sources
- Healthcare Industry Reviews, Hospital Bad Debt Study: analysis of Worksheet S-10 in CMS HCRIS Form 2552-10 cost reports for HCRIS fiscal years 2023 and 2024, conducted October 2026.
- HCRIS hospital cost report data, FY2025 file. Centers for Medicare & Medicaid Services.
- HCRIS hospital cost report data, FY2024 file. Centers for Medicare & Medicaid Services, file released October 6, 2026.
- HCRIS hospital cost report data, FY2023 file. Centers for Medicare & Medicaid Services, file released October 6, 2026.
- Cost reports. Centers for Medicare & Medicaid Services.
- Hospital 2552-2010 form cost report data files. CMS.
- Provider Reimbursement Manual, Part 2, Chapter 40, Hospital and Hospital Health Care Complex Cost Report, Form CMS-2552-10. CMS, Rev. 25. Used for the Worksheet S-10, S-2 and G-3 line definitions.